Analyzing Impact of COVID-19 on North America Shale Gas Market
Evaluating Financial Stability During & Post Pandemic
We understand the intense effect of the coronavirus on numerous businesses across the globe, affecting the opportunities, marketing strategies, and pricing models, that are further affecting the growth of the businesses worldwide. We provide updated pointers in this economic pandemic to help the conglomerates to sustain in these uncertain and challenging times and ensure that they take affirmative business decisions. Know More
The Research Report is Updated with 2022 Base Year, 2023 Estimated year and Forecast till 2033 with Market Insights.
With the dip in global production, the GDP has contracted in 2022 and impacted the market across the world. Upon placing a Sample Request, you will receive an updated report with 2022 as base year, 2023 as estimated year and forecast to 2033. This will have market drivers, recovery rate in the market, insights and competitive analysis.
Introduction and Overviews
The growth of the North America Shale Gas market is driven by higher demand for energy and power among the population in the region, owing to growth in consumption of energy by the population and changing climatic conditions, due to global warming raising the demand for power. Alternative sources of energy have become higher in demand, with United States of America (U.S.) exploring ways to tackle high energy demands with sustainable energy solutions. The market is further anticipated to grow on the back of rising demand for alternative sources of energy in the region.
As per Centre for Climate and Energy Solutions (C2ES), renewable energy has grown at the fastest rate as compared to other sources, with solar generation estimated to become the fastest growing electricity source that is anticipated to grow from 7% in 2015 to around 36% of the total energy renewable generation in the U.S. by 2050. About ten (10%) percent of the energy consumed across sectors in the U.S. was from renewable sources in the year 2016, which is anticipated to grow over the next twenty five years at an average annual rate of 2%, that is higher than the overall growth rate in energy consumption (0.2% per year) according to Centre for Climate and Energy Solutions (C2ES). Around 15 percent of electricity generation had arisen from renewables in the year 2016 which could rise to 25 percent by 2030 in the U.S. The majority of the power generation had arisen from hydro, wind and biomass. The use of hydropower is anticipated to help reduce greenhouse gas emissions and they operate at relatively lower costs. However, a dam for creation of a reservoir or diversion of water to a hydropower plant may alter the ecosystem and physical characteristic of the river. The transport sector saw a considerable rise in use of renewable fuels such as ethanol and biodiesel during the past decade. E85 (ethanol transportation fuel) is a type of renewable energy fuel which is anticipated to grow at the fastest rate at an average annual rate of 9.7 percent over the next 25 years, even if it starts from a very low base. On the other hand, biomass constitutes about 98 percent of renewable energy use that comprises of nearly 60 percent of biomass wood, 33 percent from biofuels and nearly 8 percent from biomass waste.
Top Macro-Economic Indicators Impacting the Growth:

Currently, about 5% of the global production of natural gas arises from Canada, being the fifth largest producer in the world. Canada reported a production of about 23.7 million cubic metres of crude oil in December, 2018 as against a production of 21.2 million cubic metres in January 2017. The energy supply per capita in Canada remains the largest among the IEA (International Energy Agency) member countries. Canada recorded a production of 28.2 million MWh of electricity through hydro generation as of 2019. According to Canadian Association of Petroleum Producers, Canada exported energy materials comprising of a value worth USD 122,942.9 million as of 2018.
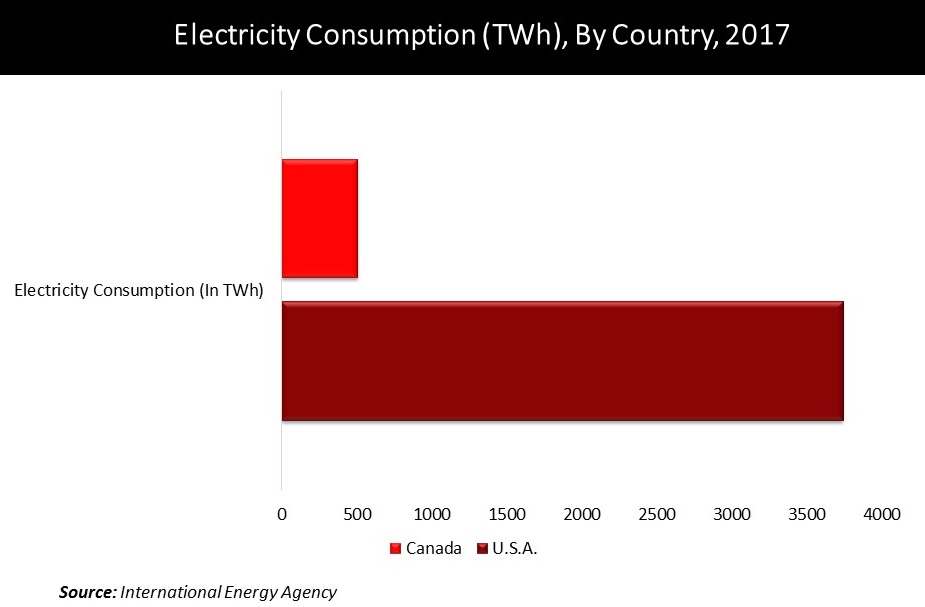
The usage of fossil fuels such as natural gas had risen significantly in the year 2018 in the region, with the U.S. being the single biggest driver of higher demand, recording a gain of 80 billion cubic metres (bcm) that was 10.5% higher than the previous year. The consumption of natural gas in the U.S. had increased over the last decade. The demand for natural gas had spiked by about 10% in 2018 which was considered to be the highest growth in demand in the last thirty (30) years. This is on account of increase in number of gas-fired power plants and growth in the establishment of number of buildings. The demand for fossil fuels constitute about 80% of the U.S. primary energy consumption as of 2018. The U.S. had seen a growth in demand for electricity, owing to factors such as growing population and economic activity. The maximum generation of power in the U.S. is through the use of fossil fuels such as coal which provided more than 50% of all electricity generated in the U.S. U.S. reported a significant demand for natural gas by recording a consumption of about 3738 TWh of power in 2017.
With CO2 emissions rising at a considerable rate, many opportunities are opening up for key market players to adopt renewable energy sources such as solar panels and solar panel recycling which are known to be sustainable. Growing concerns about ecological imbalance and environment degradation has forced governments to shift their focus towards renewable energy that can offer sustainable growth. The International Renewable Energy Agency (IRENA) has reported that the overall volume of accumulated photovoltaic panel waste across the globe were estimated to account for about 60-70 million tons by 2050. Many green projects are being encouraged by coming out with energy efficient ways to manage waste by various government bodies.
Our overall market analysis on the North America Shale Gas market includes recent trends, opportunities coupled with inclusive macro-economic indicators that are leading to the growth of the market. Moreover, our bottom-up and top-down approach to calculate the market numbers along with detailed segmentation and regional average pricing analysis is provided in the report. Additionally, our report highlights correlation and regression analysis, demand and supply risk, followed by strategies to attract potential customers. Furthermore, our report includes Y-o-Y growth rate and absolute $ opportunity value that the North America Shale Gas market is estimated to record in 2027 as compared to this year.
Export and Import Scenario:

Geographic Overview
A separate section in the report highlights regional scenario in market which includes North America (further segregated into U.S. and Canada).
Competitive Landscape
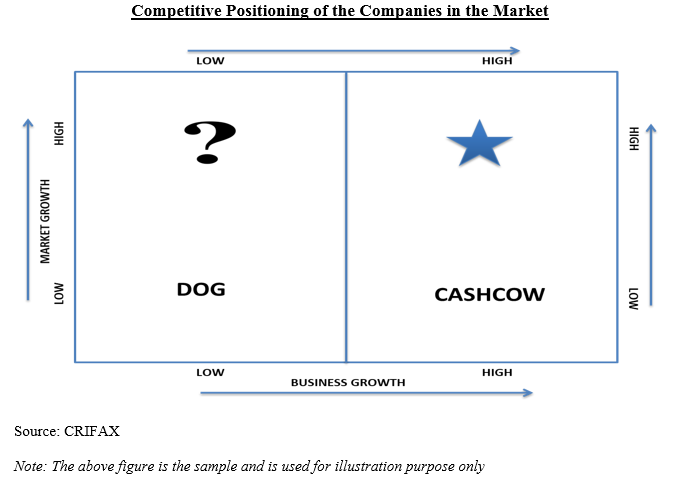
A complete section on competitive landscape provides an understanding of the companies in current strategic report based upon various parameters which includes overview of the company, business strategy, major product offerings, key performance indicators, risk analysis, recent development, regional presence and SWOT analysis. There is a separate section which has been provided on the market share of key players in this market, as well as the competitive positioning of the players.

Key Topic Covered
- Market Size, Demand, Y-o-Y Growth Comparison
- Market Segmentation Analysis
- Market Segmentation Analysis by Geography
- North America (U.S. and Canada)
- Latin America (Brazil, Mexico, Argentina, Rest of Latin America)
- Europe (Germany, France, UK, Spain, Italy, BENELUX, NORDIC, Russia, Poland, Turkey, Hungary, Rest of Europe)
- Asia Pacific (China, Japan, India, South Korea, Indonesia, Malaysia, Australia, New Zealand, Rest of Asia Pacific)
- Middle East and Africa (GCC, North Africa, South Africa, Rest of Middle East and Africa)
- Absolute $ Opportunity
- Regional Average Pricing Analysis
- Demand and Supply Risk
- Regulatory Landscape
- Regression and Correlation Analysis
- Porters Five Force Model
- Market Dynamics
- Growth Drivers
- Demand Side Drivers
- Supply Side Drivers
- Economy Side Drivers
- Challenges
- Trends
- Opportunities
- Growth Drivers
- Macro-economic Indicators impacting the growth of the market
- Competitive Landscape
- Market Share of the companies
- Competitive Positioning of the companies
- Overview of the companies
- Key Product Offerings
- Business Strategies
- Financial Performance
- Key Performance Indicators
- Risk Analysis
- SWOT Analysis
- Recent Developments
- Regional Presence
Major Target Audience for this report:
- Manufacturers of the product
- Suppliers of raw materials
- Distributors
- Strategic and management consulting firms
- Investors
- Investment banks
- Various regulatory and Government bodies
- Industrial Associations
- Research Organizations and institutes
- Organizations, alliances and forums related to this market
Crucial Questions Answered in this report:
- How the market is going to be impacted based upon the macroeconomic indicators?
- What are the various opportunities in Shale Gas market?
- Which segment and which country has the fastest growth?
- Complete analysis of the competitive landscape
- Where the maximum opportunity lies in terms of further investments by region?
- Potential countries for investment
Scope for the Customization:
We are open for the customization of this report for our client.


